Introduction ✨
Every trader has a system, but every system is unique. My approach is built around understanding market structure, following my custom indicators, and using a very specific Fibonacci method that works for me. While it might look complex at first glance, it’s actually very systematic and disciplined. In this article, I’ll walk you through the core of my trading setups — how I read the market, the indicators I rely on, and my Fibonacci rules.
Market Structure: Watching Liquidity Zones Differently 🔍
Most traders focus on liquidity zones by observing where the crowd is trading and following the majority. I take the opposite approach. I look at what other traders are likely doing in a given situation and position myself in contrast. This is the core of my market structure analysis.
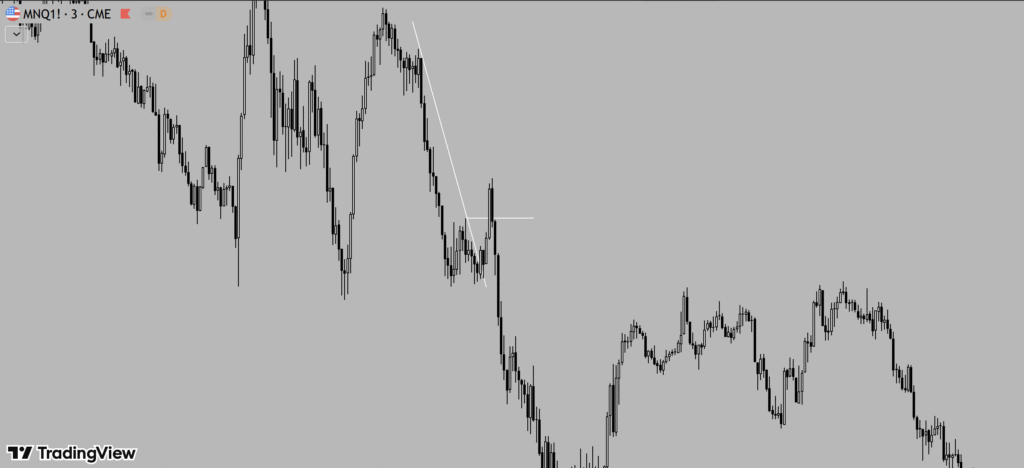
On the chart above, you can see a double bottom forming near a relatively key level, which also breaks the trendline to the upside. In these situations, I actually look for a setup in the opposite direction — downwards. If the price goes up, I don’t complain 😅, but if it moves down, I’ve won against those traders who are trying to go long.
I always wait for confirmation across multiple timeframes. Typically, I use 3x or 1/2 of the timeframe I’m trading on. For example:
- If I see a potential opportunity on the 1-minute chart, I check the 3-minute chart for confirmation
- Sometimes, a setup looks great on the 1-minute chart, but I need to monitor it on the 30-second chart for the perfect entry
This multi-timeframe confirmation ensures that I’m entering setups with higher probability and reduces risk significantly.
My Indicator Setup 🛠️
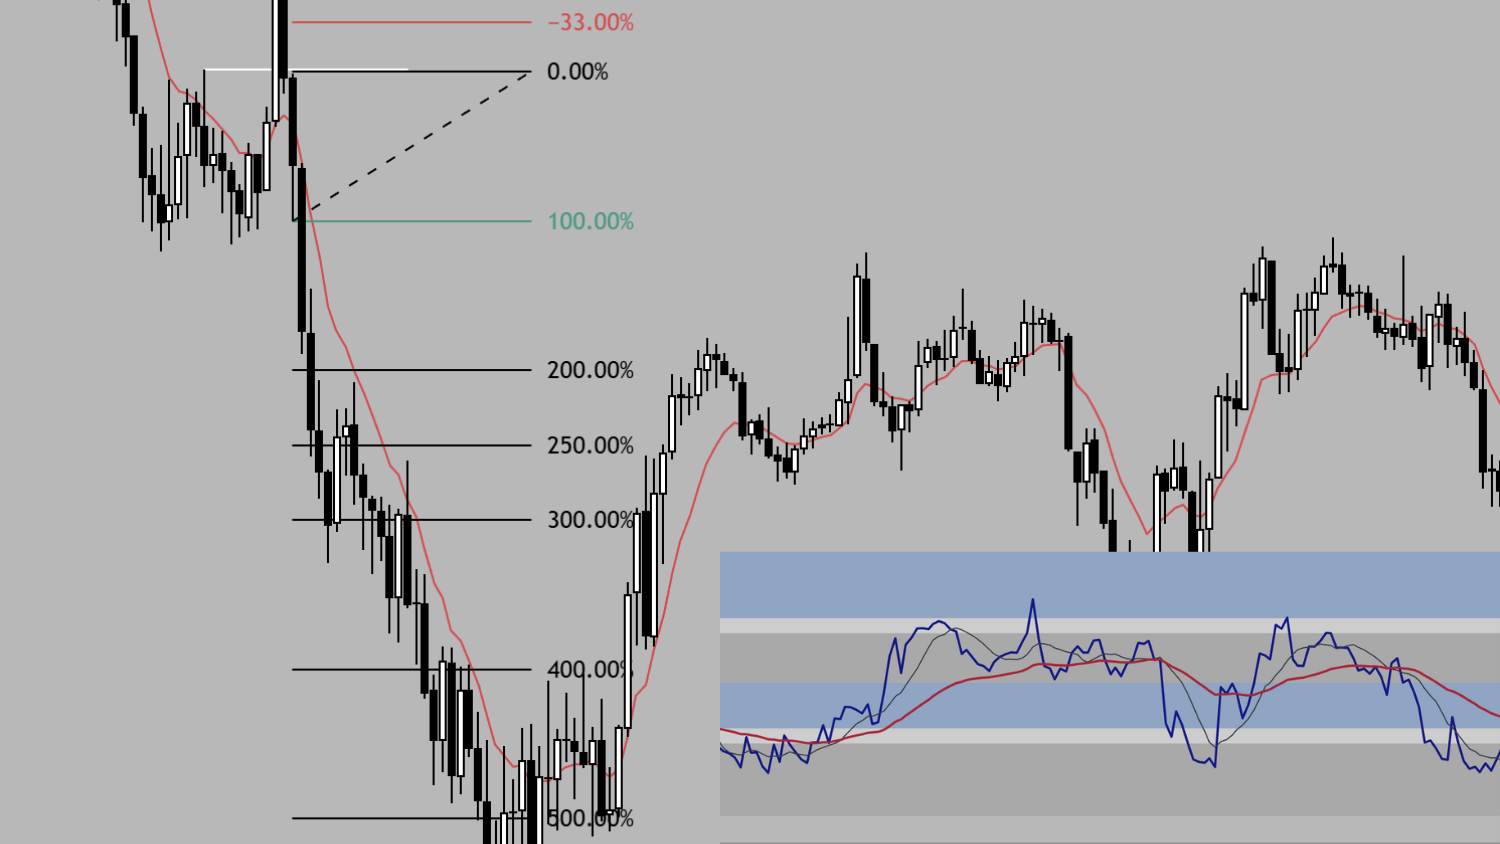
Indicators are a big part of my decision-making. I use a very complex, custom-modified RSI as my primary tool. Here’s how it works:
- RSI with 14 periods
- Four custom zones, each color-coded for clarity
- Overlaying SMA 9 and EMA 39 directly on the RSI
- On the chart itself, I also use EMA 10 and SMA 20
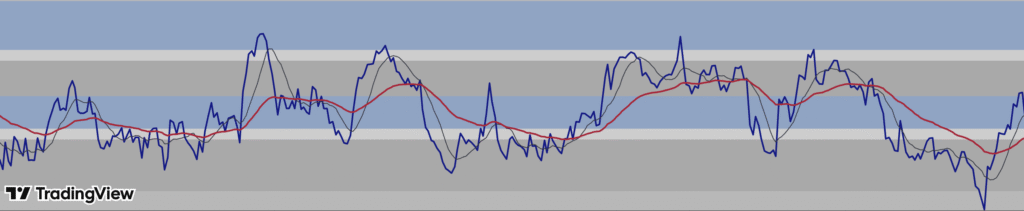
This combination gives me a clear view of momentum, trend, and overbought/oversold conditions ⚡ in a way that aligns with my trading style.
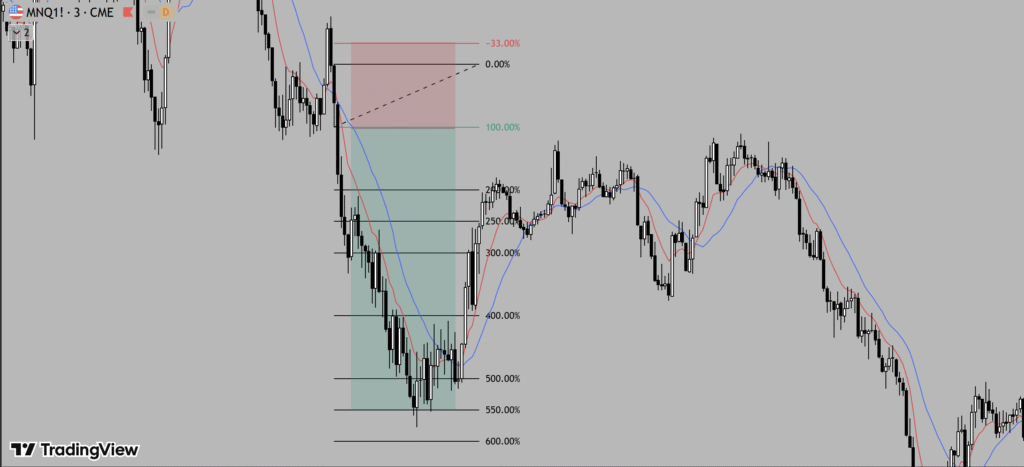
My Unique Fibonacci Method💎
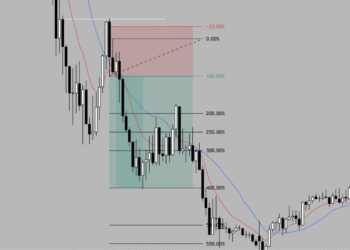
I have a very specific Fibonacci setup that I follow strictly.
- The key levels I watch are 100% (entry) and -33% (stop loss)
- Above 100%, I only monitor 200%, 250%, 300%, 400%, 500%, 550%, 600%, and 700% levels for potential profit-taking
- I personally don’t aim for more than these levels — it’s enough profit for me, and it keeps trades simple and manageable
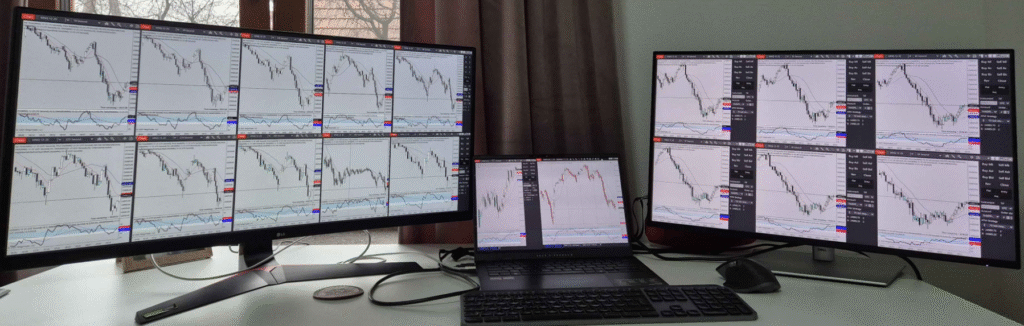
How I Monitor Multiple Charts 👀
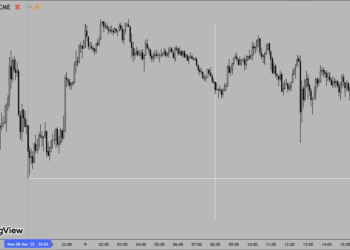
Trading is not just about the setup — it’s also about observation. I usually monitor 19–20 charts at the same time, but I never look at more than 75 candles per chart.
My preferred timeframes range from 15 seconds up to 15 minutes. I avoid longer timeframes because I lack patience for extended trades 😅. I want to know quickly whether a trade is profitable or not. Most of my trades occur between 30 seconds and 3 minutes, which suits my scalping style perfectly ⚡.
Putting It All Together: My Core Setup 🧩
Here’s a summary of my core trading setup:
- Identify liquidity zones differently — position opposite to most traders.
- Check multiple timeframes — ensure confirmation before entering.
- Use custom indicators — RSI with zones, SMA 9, EMA 39, plus chart EMA 10 and SMA 20.
- Apply my Fibonacci method — enter at 100%, stop at -33%, monitor higher levels for profit.
- Focus on short timeframes — trades usually last 30s to 3m.
- Watch multiple charts systematically — never overload with too many candles.
This combination creates a systematic, repeatable approach that fits my personality, my style, and my patience level. It may look complex, but it’s structured and clear once you understand the logic behind each step.
Conclusion ✅
Trading is personal. What works for me might not work for everyone, but sharing my core setups can give you insights into market structure, indicators, and Fibonacci-based entries. The goal is always consistency, repeatability, and risk control.
By mastering these fundamentals, I can confidently scale my setups, monitor multiple opportunities, and execute trades efficiently — all while keeping the process manageable and stress-free.
If you want to see live examples of these setups in action, check out my Trade Recaps, where I post new trades, charts, and analysis regularly.