Understanding Swing Highs and Swing Lows is one of the most important foundations of technical analysis and price action trading. These concepts help traders read market structure, identify trend direction, and spot potential trade opportunities based on structure breaks.
What Is a Swing High?
A Swing High is a price point where the market creates a local high, followed by a move lower. In simple terms:
- Price moves up
- Reaches a high
- Then pulls back
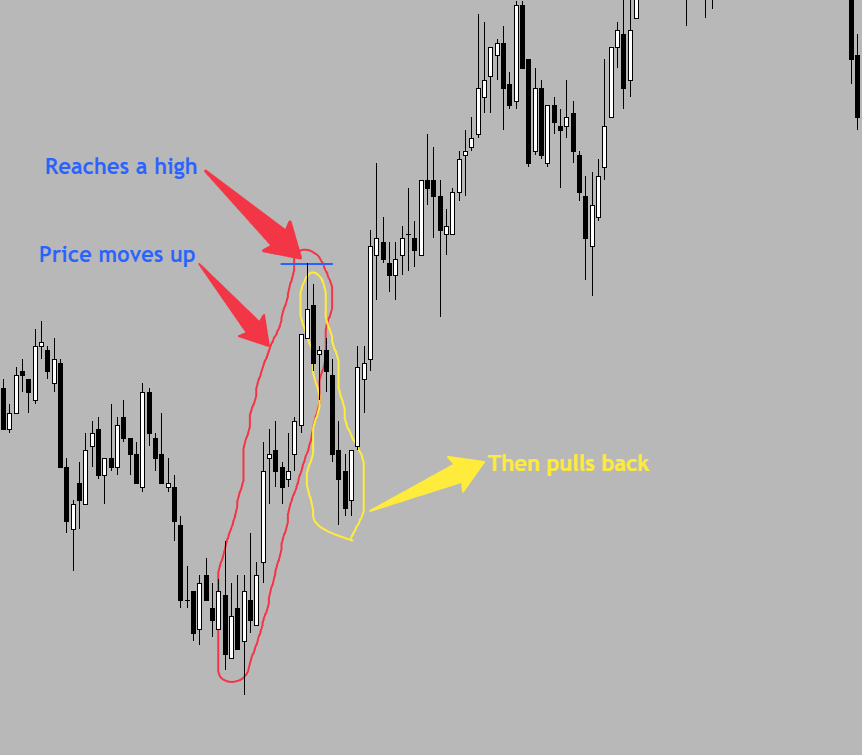
This high represents an area where selling pressure temporarily overcame buying pressure.
What Is a Swing Low?
A Swing Low is the opposite. It is a local low where:
- Price moves down
- Finds support
- Then starts moving higher
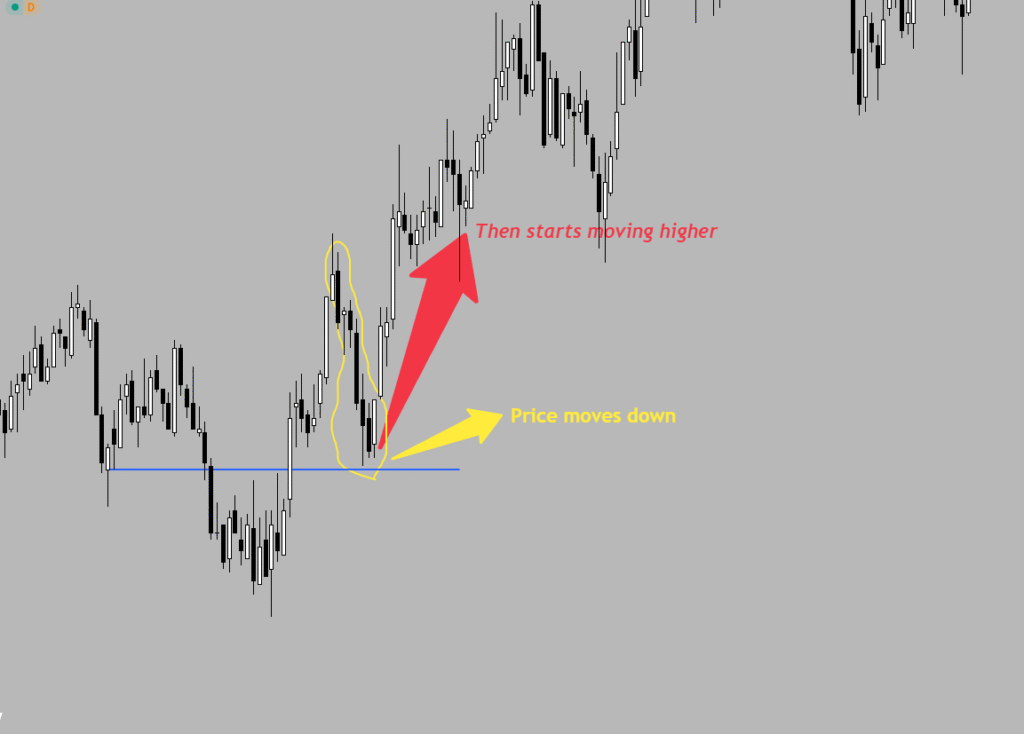
Swing Lows represent areas where buyers step in and push the price back up.
How Price Builds Structure
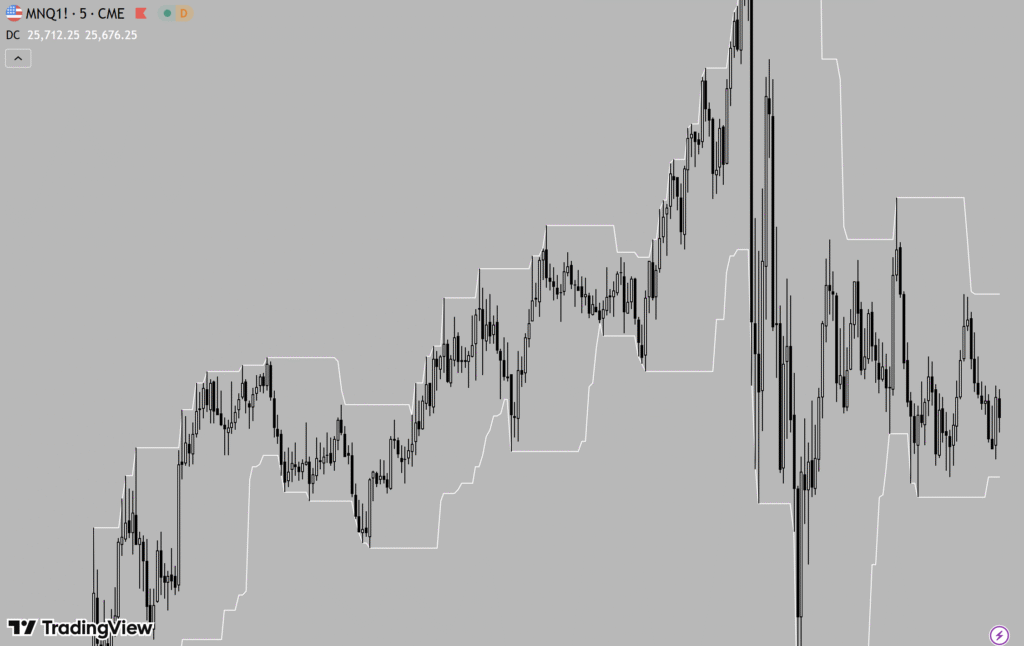
Market structure is built from a sequence of swing highs and swing lows. The best indicator for identifying swing lows and highs for new traders: Donchian Channels

Bullish Market Structure
In an uptrend, price forms:
- Higher Highs (HH)
- Higher Lows (HL)
The logic is simple:
- Price breaks above a previous Swing High
- The candle closes above that high
- Price continues moving in that direction
This confirms a bullish structure break and shows that buyers are in control.
After the breakout, price usually pulls back and forms a Higher Low, which becomes a key level to watch.
Structure Break Explained
A structure break happens when price violates an important swing point.
Bullish Structure Break
- Price closes above a Swing High
- Confirms continuation of the uptrend
- New Higher High is formed
This is often where traders look for long opportunities after a pullback.
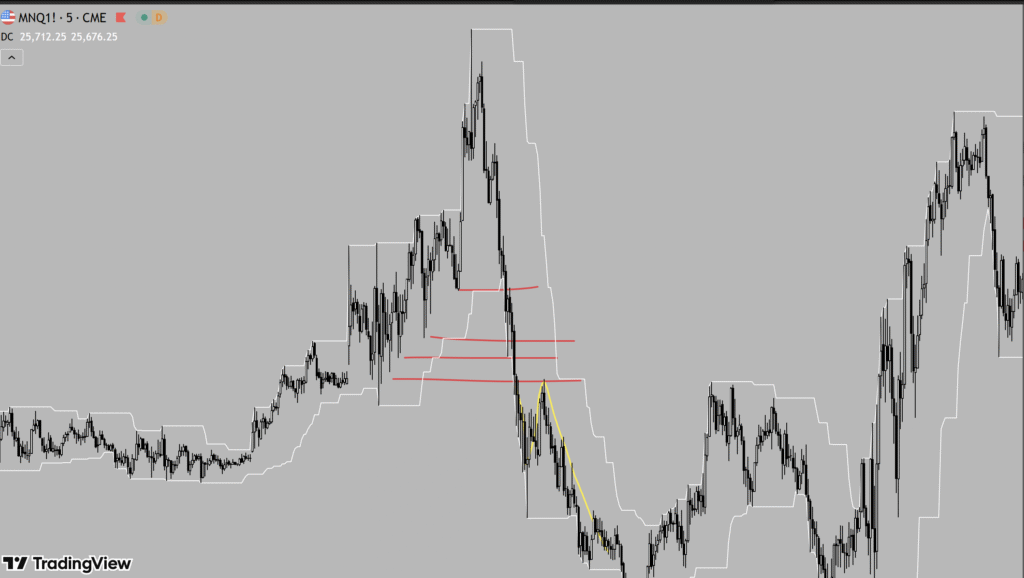
When Structure Turns Bearish
As long as price respects the last Higher Low, the bullish structure remains valid.
However, when:
- Price closes below the last Higher Low
This signals a bearish structure break.
At this point:
- The uptrend is no longer valid
- Market structure shifts
- Traders stop looking for longs
- Short setups become the priority
This transition is critical. Many traders get trapped trying to buy while structure has already broken.
Bearish Market Structure
In a bearish environment, price forms:
- Lower Lows (LL)
- Lower Highs (LH)
After a bearish structure break:
- Price creates a new Lower Low
- Pulls back into a Lower High
- Continues lower
This is where traders focus on short trades, aligning with market structure.
Why Swing High & Low Matter
Swing Highs and Lows:
- Define trend direction
- Show who controls the market (buyers or sellers)
- Help avoid trading against structure
- Create clear invalidation levels
They are not indicators — they are pure price action.
Key Takeaways
- Swing High = local high followed by a pullback
- Swing Low = local low followed by a push higher
- Closing above a Swing High = bullish structure break
- Closing below the last Higher Low = bearish structure break
- Trade with structure, not against it
Mastering swing highs and swing lows will dramatically improve your ability to read the market and stay aligned with the dominant direction.